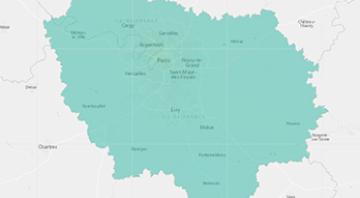
Commentaire du prévisionniste
Concentration des polluants
Niveau maximum sur les stations mesurant la pollution ambiante de l'agglomération compris entre
- 20 µg/m³ and 50 µg/m³ pour no2
- 80 µg/m³ and 110 µg/m³ pour o3
- 10 µg/m³ and 20 µg/m³ pour pm10
- 5 µg/m³ and 10 µg/m³ pour pm25
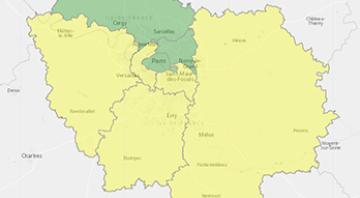
- 40 µg/m³ and 70 µg/m³ pour no2
- 80 µg/m³ and 110 µg/m³ pour o3
- 10 µg/m³ and 20 µg/m³ pour pm10
- 5 µg/m³ and 15 µg/m³ pour pm25
À quoi sert la prévision ?
Cette mission particulièrement importante est réalisée par une équipe de prévisionnistes, qui prévoient chaque jour l’indice de qualité de l’air ATMO pour le jour même et le lendemain. Cet indice journalier représente votre exposition globale en situation de fond sur la journée en prenant en compte les polluants suivants : l’Ozone (O3), le dioxyde d’azote (NO2), les particules PM10, le dioxyde de soufre (SO2) et, depuis le 1er janvier 2021, les particules PM2.5. Cet indice a en effet fait peau neuve à cette date, avec une modification des seuils, en cohérence avec l’indice européen, et la prise en compte des particules PM2.5.
Au-delà du bulletin journalier de qualité de l’air, Airparif est chargée par les autorités, et notamment le Préfet de Police, de prévoir et de détecter les épisodes de pollution. Airparif apporte son expertise sur : l’origine de l’épisode, le(s) polluant(s) concerné(s), le nombre de personnes potentiellement impactées et les territoires touchés. Airparif évalue aussi les tendances à venir pour que les franciliens soient informés et que des mesures adaptées puissent être mises en place par les autorités afin de diminuer l’intensité du pic. La prévision des épisodes de pollution concerne le dioxyde d’azote, l’ozone et les particules PM10 (qui intègrent également les PM2.5), conformément à la procédure d’information et d’alerte.
Appli, web, médias, panneaux urbains… ces résultats sont diffusés chaque matin et permettent de s’informer pour adapter ses activités : notamment pour se protéger et pour réduire ses émissions en cas d’épisode de pollution.
Comment est-elle réalisée ?
Comme pour la météo, il est possible de réaliser une prévision de la qualité de l'air. Cette prévision, complexe à réaliser, intègre de nombreuses données et paramètres.
Elle nécessite de prendre en compte simultanément les différents éléments intervenant dans la formation de la pollution atmosphérique et d’évaluer leur évolution au cours de la journée :
- Les émissions locales, régionales et l'analyse de leur provenance (trafic, industrie, chauffage, agriculture, etc.);
- Les transferts de pollution (par exemple l'ozone importé d'autres régions ou encore la recirculation des masses d'air);
- Les données météorologiques;
- Les transformations des polluants dans l'air en lien avec des phénomènes physico-chimiques;
- Les observations des mesures relevées par les stations.
Ainsi, chaque jour, les prévisionnistes d'Airparif utilisent leurs connaissances sur la qualité de l’air en Île-de-France, et aussi en matière de chimie de l'air et des comportements des polluants dans l’atmosphère. Les données issues de nos stations de mesure et les prévisions météorologiques françaises, fournies quotidiennement par notre partenaire Météo-France, mais aussi européennes, sont analysées et comparées aux simulations de différentes modélisations, notamment celles de la plateforme interrégionale ESMERALDA gérée par Airparif. À l'issue de ces analyses, ils émettent un bulletin indiquant les indices locaux de qualité de l'air prévus pour la journée et ceux du lendemain, les concentrations maximales attendues sur l'agglomération pour les principaux polluants, et, le cas échéant, la prévision d'un épisode de pollution et son origine.
Saviez-vous que plus de 78 % des prévisions d'indice réalisées par les prévisionnistes d'Airparif sont exactes ?
Pour aller plus loin
- Les sources de la pollution
Les polluants peuvent être d’origine anthropique, c'est-à-dire produits par les activités humaines, ou d’origine naturelle (émissions par la végétation, l’érosion du sol, les volcans, les océans, etc). Tous les secteurs d’activité humaine sont susceptibles d’émettre des polluants atmosphériques : les transports (routiers et non routiers), les activités industrielles, les activités domestiques (chauffage en particulier), l’agriculture, , les chantiers, ….
Pour autant, les polluants observés dans l’atmosphère ne sont pas tous émis directement par ces sources. Pour les polluants secondaires, ils résultent aussi de réactions physico-chimiques entre composants chimiques présents dans l’atmosphère, en lien aussi avec des conditions météorologiques spécifiques.
La compréhension des phénomènes de pollution et leur prévision nécessitent ainsi une bonne connaissance des sources de polluants, de leur répartition géographique, et des quantités de polluants émises au long de l’année, mais aussi une interprétation par rapport à la connaissance des évolutions sur le court et le moyen-long terme. Ces émissions peuvent en effet varier nettement en fonction des périodes de l’année, voire du moment de la journée, mais aussi au fil des années en fonctions des plans d’actions mis en place.
- Le lien entre qualité de l'air et météorologie
La qualité de l'air dépend majoritairement de l'intensité des émissions polluantes, ainsi que de la météorologie qui conditionne de manière importante leur dispersion ou leur accumulation dans l’atmosphère, ainsi que la formation de polluants secondaires. Pour un même niveau de pollution, la météorologie peut de ce fait jouer un rôle dispersif ou, au contraire, aggravant.